
|
 |
- Home
- News
- Team
- Databases
- Conferences
- Oxford Studies on the Roman Economy
- Coin Hoards of the Roman Empire Project
- Affiliated Projects
- Publications
- Bibliographies
- Working Papers
- Links
New Visualisations of OxREP Data
01-03-2017 | ||||
Four new data visualisations are now available for the Mines and Shipwrecks databases. Follow the links below to explore the features: These visualisations were developed by Martin Hadley. | 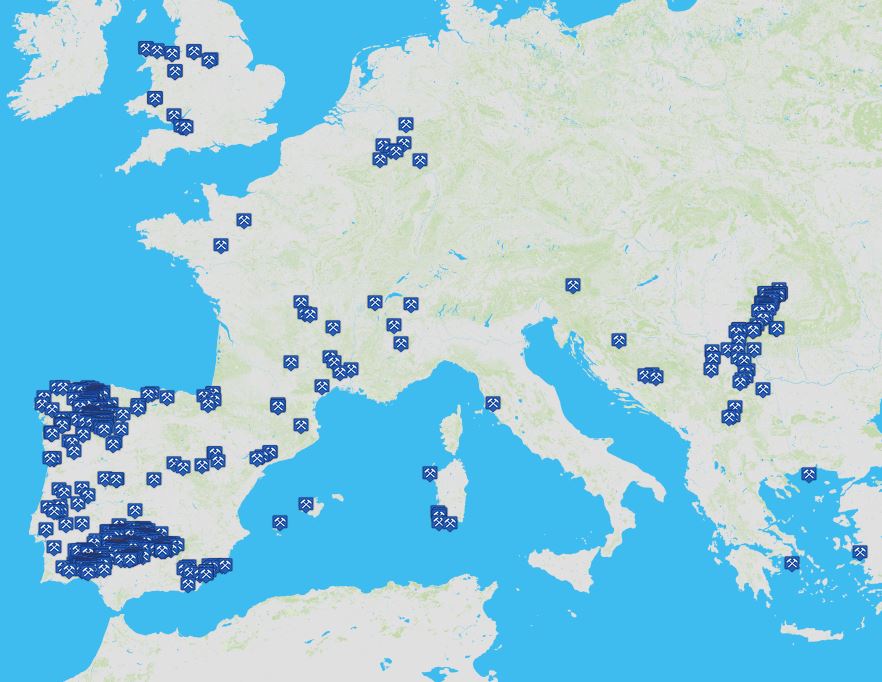 |
Webdesign, databasedesign: Miko Flohr, 2010-2025. Content: OXREP, 2005-2025.